Stochastic gradient Langevin dynamics
import blackjax
import flax.linen as nn
import jax
import jax.numpy as jnp
import jax.random as jr
import jax.scipy.stats as stats
import matplotlib.pyplot as plt
import numpy as np
from jax.flatten_util import ravel_pytree
from matplotlib.gridspec import GridSpec
from sklearn.preprocessing import StandardScaler

from pbnn.mcmc.langevin import sgld
from pbnn.utils.plot import plot_on_axis

%load_ext watermark
Generate data
def test_function(x):
    return np.sin(2.0 * x) + np.cos(x)


n = 100
noise_level = 0.1

np.random.seed(0)
X = 20 * np.random.rand(n, 1)
X_test = np.linspace(0, 20, 200)[:, None]

noise, noise_test = (
    np.random.randn(n, 1) * noise_level,
    np.random.randn(len(X_test), 1) * noise_level,
)

y = test_function(X) + noise
y_test = test_function(X_test) + noise_test

scaler = StandardScaler()
X_ = scaler.fit_transform(X)
X_test_ = scaler.transform(X_test)

X_, y = jnp.array(X_), jnp.array(y)
X_test_, y_test = jnp.array(X_test_), jnp.array(y_test)
Define the network, loglikelihood and logprior
# define loglikelihood et logprior
class MLP(nn.Module):
    """Simple MLP."""

    hidden_features: int
    out_features: int

    @nn.compact
    def __call__(self, x):
        x = nn.Dense(
            features=self.hidden_features,
            kernel_init=nn.initializers.normal(),
            bias_init=nn.initializers.normal(),
        )(x)
        x = nn.tanh(x)
        x = nn.Dense(
            features=self.hidden_features,
            kernel_init=nn.initializers.normal(),
            bias_init=nn.initializers.normal(),
        )(x)
        x = nn.tanh(x)
        x = nn.Dense(
            features=self.out_features,
            kernel_init=nn.initializers.normal(),
            bias_init=nn.initializers.normal(),
        )(x)
        return x


network = MLP(hidden_features=50, out_features=1)


def loglikelihood_fn(parameters, data, sig_noise: float = noise_level):
    """Gaussian log-likelihood"""
    X, y = data
    return -jnp.sum(
        0.5 * (y - network.apply({"params": parameters}, X)) ** 2 / sig_noise**2
    )


def logprior_fn(parameters):
    """Compute the value of the log-prior density function."""
    flat_params, _ = ravel_pytree(parameters)
    return jnp.sum(stats.norm.logpdf(flat_params))
Run the SGLD algorithm
# set some hyperparameters
step_size = 1e-5
num_iterations = 100_000
burnin = 80_000
batch_size = 32

# generate initial positions
rng_key = jr.PRNGKey(0)
keys = jr.split(rng_key)

init_positions = network.init(keys[0], X_)["params"]

# run SGLD
positions, ravel_fn, predict_fn = sgld(
    X=X_,
    y=y,
    loglikelihood_fn=loglikelihood_fn,
    logprior_fn=logprior_fn,
    init_positions=init_positions,
    batch_size=batch_size,
    step_size=step_size,
    num_iterations=num_iterations,
    rng_key=keys[1],
)

# remove burnin and thin manually
positions = jax.tree_util.tree_map(lambda xx: xx[burnin::100], positions)

# predict
f_predictions = predict_fn(network, positions, X_test_).squeeze()

# generate the noisy predictions
_, key = jr.split(keys[1])
y_predictions = f_predictions + noise_level * jr.normal(
    key, shape=(len(f_predictions), 1)
)
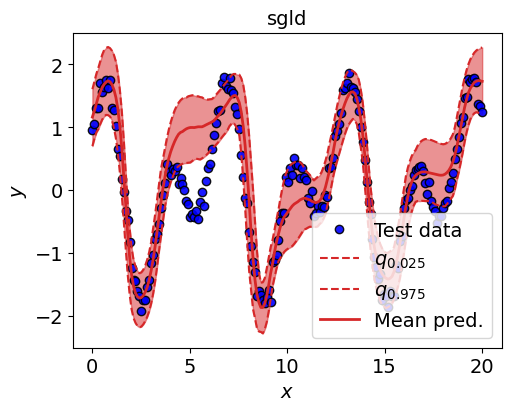
Plot the prediction intervals
fig = plt.figure(constrained_layout=True, figsize=(5, 4))
gs = GridSpec(nrows=1, ncols=1, figure=fig)
alpha = 0.05

mean_prediction = jnp.median(y_predictions, axis=0)
qlow = jnp.quantile(y_predictions, 0.5 * alpha, axis=0)
qhigh = jnp.quantile(y_predictions, (1 - 0.5 * alpha), axis=0)

ax = fig.add_subplot(gs[0])
plot_on_axis(ax, X_test, y_test, mean_prediction, qlow, qhigh, title="sgld")
%reload_ext watermark
%watermark -n -u -v -iv -w -a 'Brian Staber'
Author: Brian Staber

Last updated: Wed Mar 13 2024

Python implementation: CPython
Python version       : 3.11.7
IPython version      : 8.21.0

jax       : 0.4.23
numpy     : 1.26.3
blackjax  : 1.1.0
matplotlib: 3.8.2
flax      : 0.8.0

Watermark: 2.4.3