Analytical functions
This notebook simply shows off some analytical functions available in this package and that can be used for benchmarking.
import matplotlib.pyplot as plt
import numpy as np
from matplotlib.gridspec import GridSpec

from pbnn.utils.analytical_functions import (
    g_function,
    gramacy_function,
    heteroscedastic_trigonometric_function,
    ishigami_function,
    trigonometric_function,
)

%load_ext watermark
fig = plt.figure(constrained_layout=True, figsize=(3 * 5, 1 * 4))
gs = GridSpec(nrows=1, ncols=3, figure=fig)
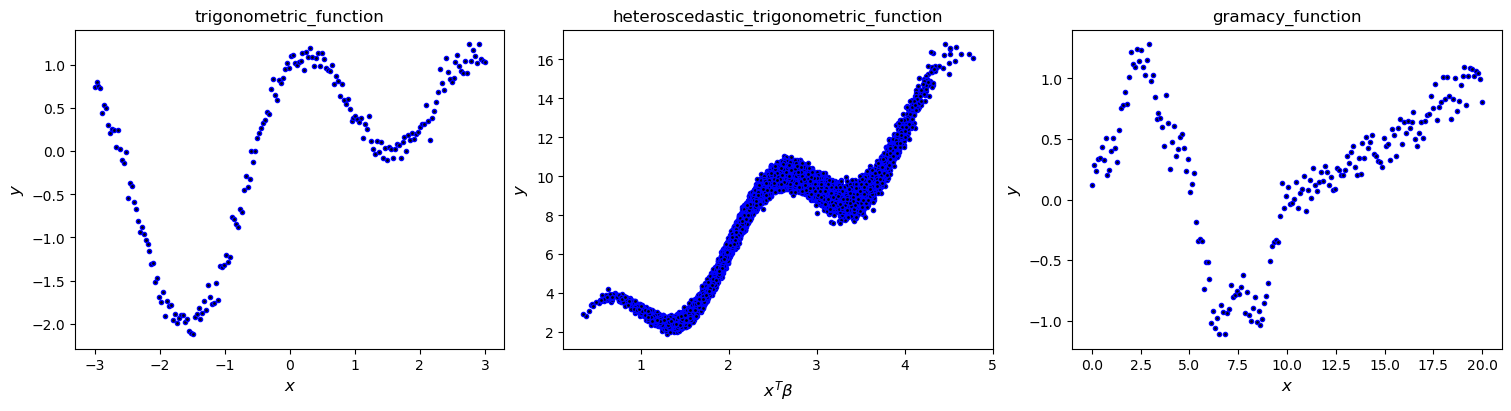
# test function 1
x = np.linspace(-3, 3, 200)[:, None]
noise_level = 0.1
noise = noise_level * np.random.randn(*x.shape)
y = trigonometric_function(x, noise)
ax = fig.add_subplot(gs[0])
ax.plot(x, y, ls="", color="k", marker=".", markeredgecolor="b", markeredgewidth=1)
ax.set_xlabel(r"$x$", fontsize=12)
ax.set_ylabel(r"$y$", fontsize=12)
ax.set_title("trigonometric_function", fontsize=12)
# test function 2
noise_level = 1.0
x = np.random.uniform(low=0, high=1.0, size=(20000, 1000))
noise_level = 0.1
noise = noise_level * np.random.randn(x.shape[0], 1)
y = heteroscedastic_trigonometric_function(x, noise)
beta = np.zeros((x.shape[1],))
beta[0:5] = 1.0
ax = fig.add_subplot(gs[1])
ax.plot(
np.dot(x, beta),
y,
ls="",
color="k",
marker=".",
markeredgecolor="b",
markeredgewidth=1,
)
ax.set_xlabel(r"$x^T \beta$", fontsize=12)
ax.set_ylabel(r"$y$", fontsize=12)
ax.set_title("heteroscedastic_trigonometric_function", fontsize=12)
# test function 3
x = np.linspace(0, 20, 200)[:, None]
noise_level = 0.1
noise = noise_level * np.random.randn(len(x), 1)
y = gramacy_function(x, noise)
ax = fig.add_subplot(gs[2])
ax.plot(x, y, ls="", color="k", marker=".", markeredgecolor="b", markeredgewidth=1)
ax.set_xlabel(r"$x$", fontsize=12)
ax.set_ylabel(r"$y$", fontsize=12)
ax.set_title("gramacy_function", fontsize=12)
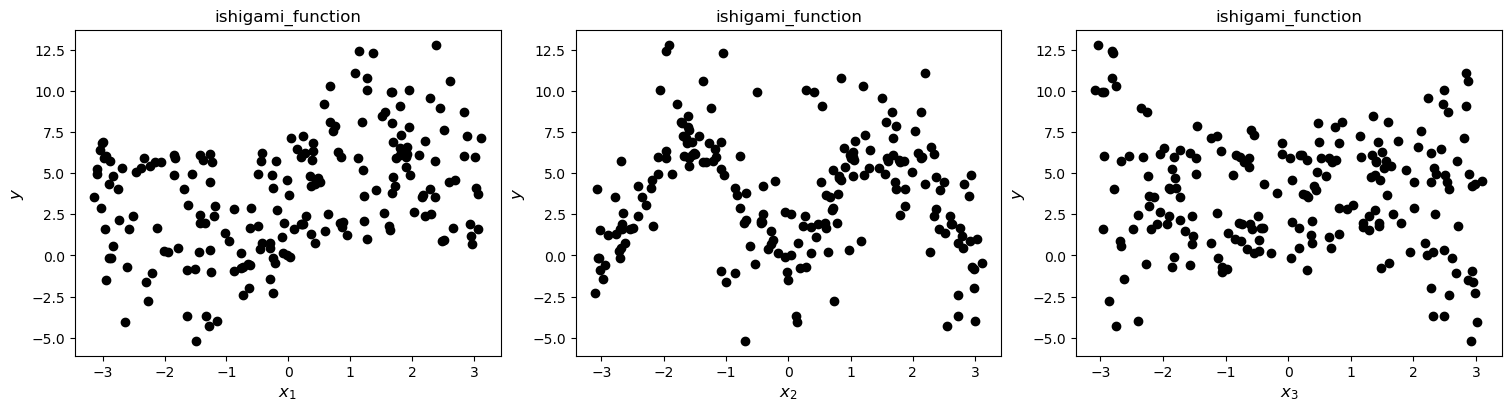
# test function 4
x = np.random.uniform(low=-np.pi, high=np.pi, size=(200, 3))
noise_level = 0.1
noise = noise_level * np.random.randn(len(x))
y = ishigami_function(x, noise)
fig = plt.figure(constrained_layout=True, figsize=(3 * 5, 1 * 4))
gs = GridSpec(nrows=1, ncols=3, figure=fig)
for i in range(3):
ax = fig.add_subplot(gs[i])
ax.plot(x[:, i], y, ls="", color="k", marker="o")
ax.set_xlabel(rf"$x_{i+1}$", fontsize=12)
ax.set_ylabel(r"$y$", fontsize=12)
ax.set_title("ishigami_function", fontsize=12)
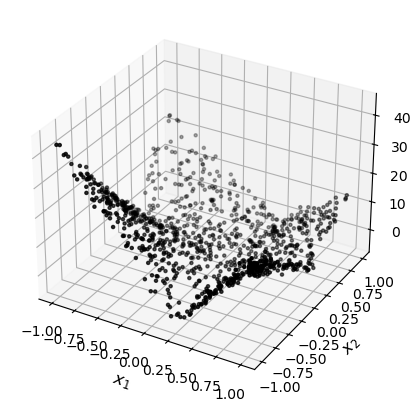
# test function 5
noise_level = 1.0
x = 2 * np.random.rand(1000, 2) - 1
noise = noise_level * np.random.randn(len(x))
y = g_function(x, noise)
fig = plt.figure(constrained_layout=True, figsize=(5, 4))
ax = fig.add_subplot(projection="3d")
ax.scatter(x[:, 0], x[:, 1], y, marker=".", color="k")
ax.set_xlabel(r"$x_1$", fontsize=12)
ax.set_ylabel(r"$x_2$", fontsize=12)
An NVIDIA GPU may be present on this machine, but a CUDA-enabled jaxlib is not installed. Falling back to cpu.
Text(0.5, 0.5, '$x_2$')
%reload_ext watermark
%watermark -n -u -v -iv -w -a 'Brian Staber'
Author: Brian Staber

Last updated: Tue Feb 27 2024

Python implementation: CPython
Python version       : 3.11.7
IPython version      : 8.21.0

matplotlib: 3.8.2
numpy     : 1.26.3

Watermark: 2.4.3