Laplace approximations
This example requires pytorch and the laplace-torch package.
import matplotlib.pyplot as plt
import numpy as np
import torch
import torch.nn as nn
import torch.optim as optim
from laplace import Laplace
from laplace.curvature.backpack import BackPackGGN
from sklearn.metrics import r2_score
from sklearn.preprocessing import StandardScaler
from torch.utils.data import DataLoader, TensorDataset

%load_ext watermark
Generate data
def test_function(x):
    return np.sin(2.0 * x) + np.cos(x)


n = 100
noise_level = 0.1

np.random.seed(0)
X = 20 * np.random.rand(n, 1)
X_test = np.linspace(0, 20, 200)[:, None]

noise, noise_test = (
    np.random.randn(n, 1) * noise_level,
    np.random.randn(len(X_test), 1) * noise_level,
)

y = test_function(X) + noise
y_test = test_function(X_test) + noise_test

scaler = StandardScaler()
X_ = scaler.fit_transform(X)
X_test_ = scaler.transform(X_test)

X_, y = torch.tensor(X_, dtype=torch.float32), torch.tensor(y, dtype=torch.float32)
X_test_, y_test = (
    torch.tensor(X_test_, dtype=torch.float32),
    torch.tensor(y_test, dtype=torch.float32),
)
Define a simple MLP
def build_mlp():
    return nn.Sequential(
        nn.Linear(1, 50), nn.Tanh(), nn.Linear(50, 50), nn.Tanh(), nn.Linear(50, 1)
    )
Post-hoc Laplace
Train the network
model = build_mlp()
train_loader = DataLoader(
dataset=TensorDataset(X_, y), batch_size=32, shuffle=True, drop_last=True
)
optimizer = optim.AdamW(model.parameters(), lr=5e-3)
loss_fn = nn.MSELoss()
for epoch in range(1_000):
for ib, (x_batch, y_batch) in enumerate(train_loader):
optimizer.zero_grad()
pred = model(x_batch)
loss = loss_fn(y_batch, pred)
loss.backward()
optimizer.step()
with torch.no_grad():
y_pred_test = model(X_test_).detach().cpu().numpy()
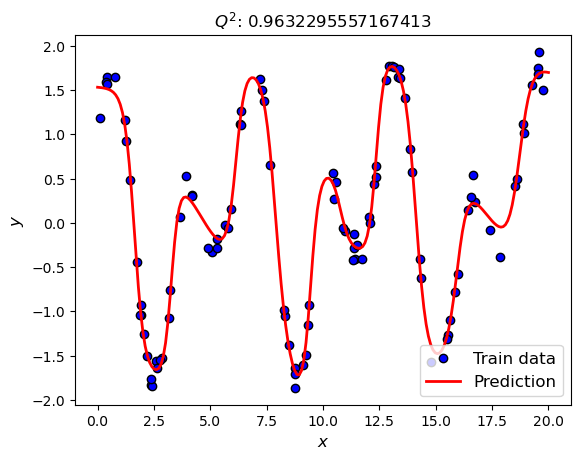
plt.figure()
plt.plot(
X,
y,
ls="",
marker="o",
markerfacecolor="b",
markeredgecolor="k",
markeredgewidth=1,
label="Train data",
)
plt.plot(X_test, y_pred_test, color="r", lw=2, label="Prediction")
plt.legend(fontsize=12)
plt.xlabel(r"$x$", fontsize=12)
plt.ylabel(r"$y$", fontsize=12)
out = plt.title(rf"$Q^2$: {r2_score(y_test, y_pred_test)}")
Fit Laplace approximation
hessian_structure = "kron"
sigma_noise = 0.1
prior_precision = 1.0
la = Laplace(
model=model,
likelihood="regression",
subset_of_weights="all",
hessian_structure=hessian_structure,
sigma_noise=sigma_noise,
prior_precision=prior_precision,
backend=BackPackGGN,
)
la.fit(train_loader)
f_mu, f_var = la(X_test_)
f_mu, f_var = f_mu.squeeze(), f_var.squeeze()
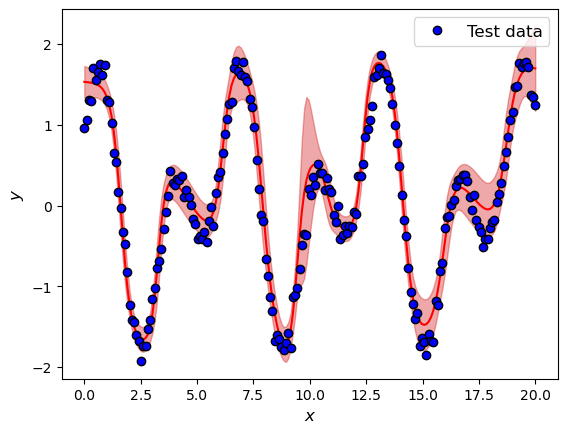
plt.figure()
plt.plot(X_test, f_mu, color="r")
plt.plot(
X_test,
y_test,
ls="",
marker="o",
markerfacecolor="b",
markeredgecolor="k",
markeredgewidth=1,
label="Test data",
)
out = plt.fill_between(
X_test.squeeze(),
f_mu - 1.96 * np.sqrt(f_var),
f_mu + 1.96 * np.sqrt(f_var),
color="tab:red",
alpha=0.4,
)
plt.legend(fontsize=12)
plt.xlabel(r"$x$", fontsize=12)
plt.ylabel(r"$y$", fontsize=12)
plt.legend(fontsize=12)
<matplotlib.legend.Legend at 0x7f4caaead990>
%reload_ext watermark
%watermark -n -u -v -iv -w -a 'Brian Staber'
Author: Brian Staber

Last updated: Wed Mar 13 2024

Python implementation: CPython
Python version       : 3.11.6
IPython version      : 8.22.2

torch     : 2.2.1
matplotlib: 3.8.3
numpy     : 1.26.4

Watermark: 2.4.3